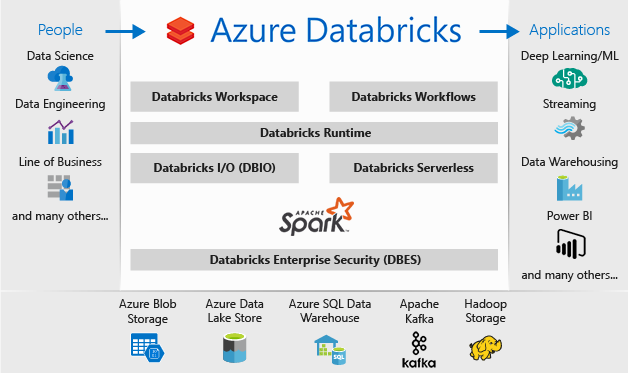
It’s been a while since my last post! How about analyzing NYC Citi Bike data with Azure Databricks. Azure Databricks is a fast, easy, and collaborative Apache Spark-based analytics platform. Designed in collaboration with Microsoft and the creators of Apache Spark, Azure Databricks combines the best of Databricks and Azure to help customers accelerate innovation with one-click set up, streamlined workflows and an interactive workspace that enables collaboration between data scientists, data engineers, and business analysts. Currently in Preview, I recommend you explore and start with the Azure Databricks Preview documentation. The Quickstarts section shows you how to create a Databricks workspace and create an Apache Spark cluster within that workspace and finally running a Spark job. Your best friend for this journey is also the Azure Databricks Guide (Documentation) check out the Getting Started section.
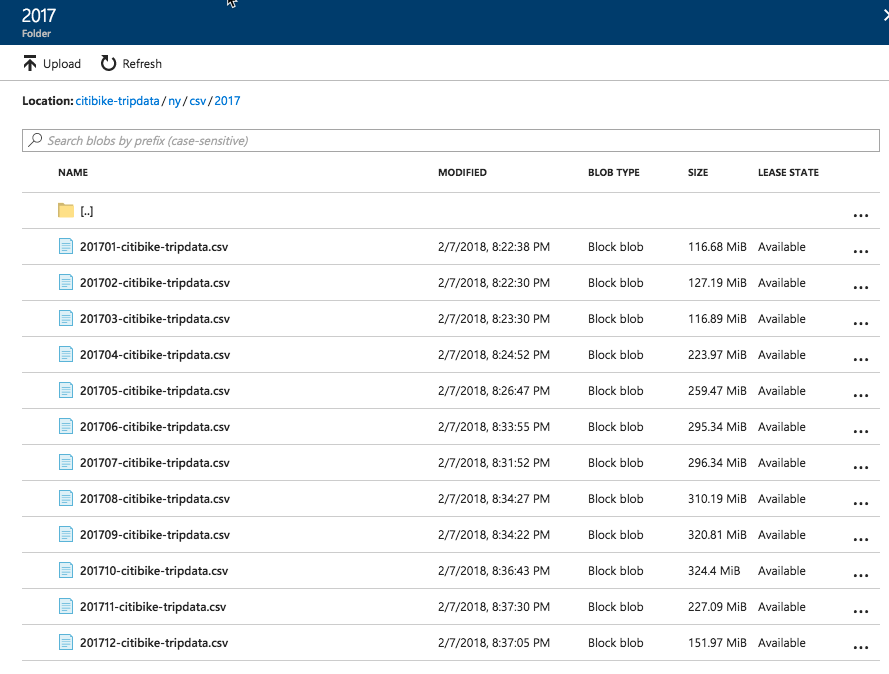
Let’s get started. I am using a subset of the Citi Bike System Data which you can explore and download from here -> tripdata. For this demo I am using data from 2017 only. Once I downloaded the required dataset I then uploaded it to my Azure Blob Storage account.
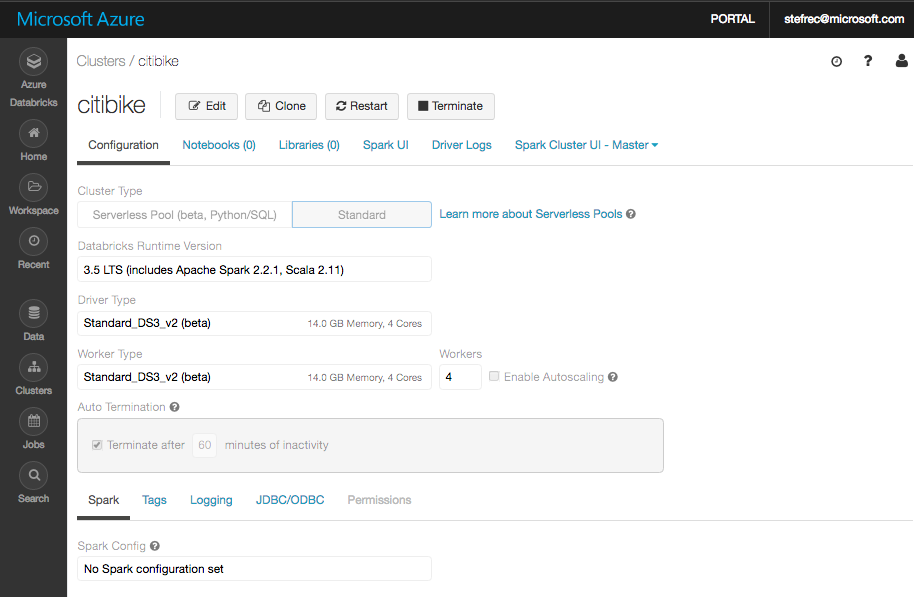
Next I created a cluster and named it “citibike”, disabled autoscaling and configure 4 workers and then set the auto termination to 60 minutes.
Then I create a Python notebook named “citibike_nyc_analysis” which you can download from GitHub here and import into your Azure Databricks Workspace and execute. The following is the ipynb file (IPython Notebook) rendered in html in an iframe for you to explore.
BTW for those of you near Ottawa, ON (Canada) I will be presenting “Introducing Microsoft Azure Databricks” next Thursday February 15 2018 at the Ottawa Data User Group Meetup