There are three types of real-time datasets which are designed for displaying visuals on real-time dashboards:
- Push dataset
- Streaming dataset
- PubNub streaming dataset
This post is about the PubNub streaming dataset, With a PubNub streaming dataset, the Power BI web client uses the PubNub SDK to read an existing PubNub data stream, and no data is stored by the Power BI service. For more more information on the other types and their capabilities read the following documentation -> Real-time streaming in Power BI.
So what is PubNub? PubNub is a global Data Stream Network and realtime infrastructure-as-a-service company. PubNub’s Data Stream Network is a high-speed publish/subscribe messaging layer, it’s deployed globally, and makes it easy to connect and scale realtime apps without managing a dedicated infrastructure for your realtime applications.
PubNub provides live syndicated data streams that you can use in your project. We are going to use the following stream Sensor Network (simulated), which mimics data from a network of outdoor field sensors.
Now let’s build a real-time dashboard… Link to heading
Hopefully you already have a Power BI Pro account, if not you can sign-up here and get started now with a free 60-day trial of Power BI Pro.
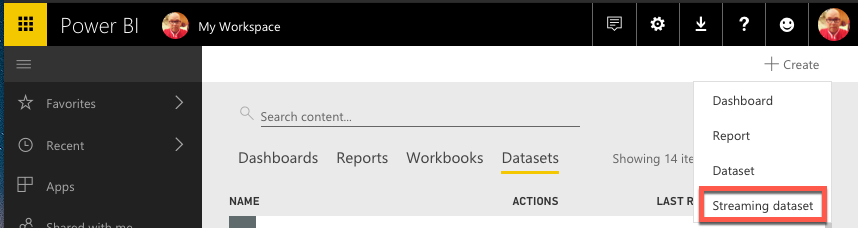
- We will first create a dataset. Once signed-in, go to your My Workspace, select Datasets, then + Create and select Streaming dataset
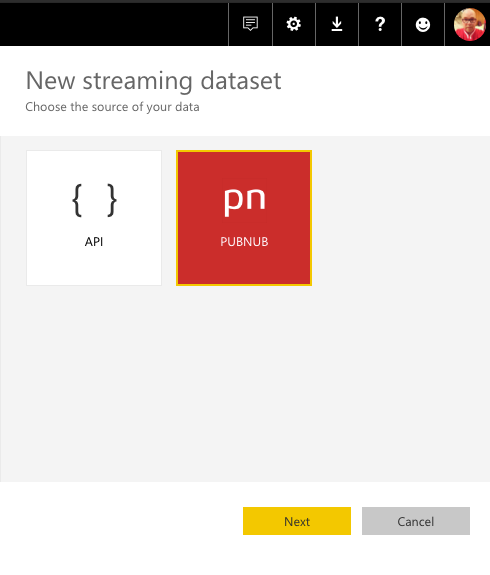
- Select PubNub and click the Next button
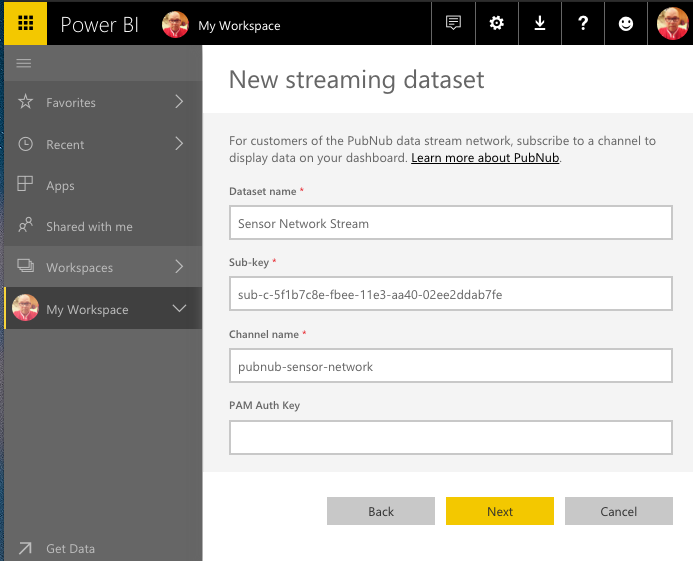
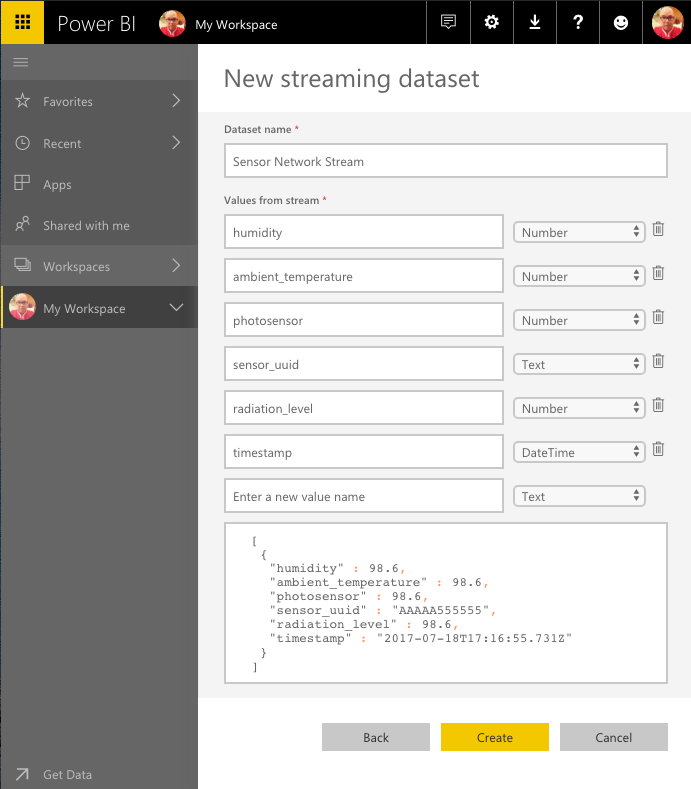
- Give your dataset a name, I chose “Sensor Network Stream” and provide the Subscription key and Channel name (copy & paste)
Subscription key: sub-c-5f1b7c8e-fbee-11e3-aa40-02ee2ddab7fe
Channel name: pubnub-sensor-network
- You will be presented with the ‘schema’ and values for this dataset, select the Create button to save the dataset
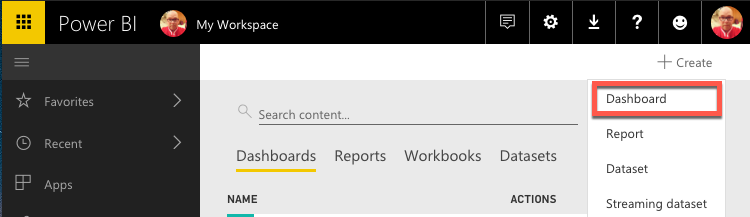
- Next we go to Dashboards, select + Create and select Dashboard
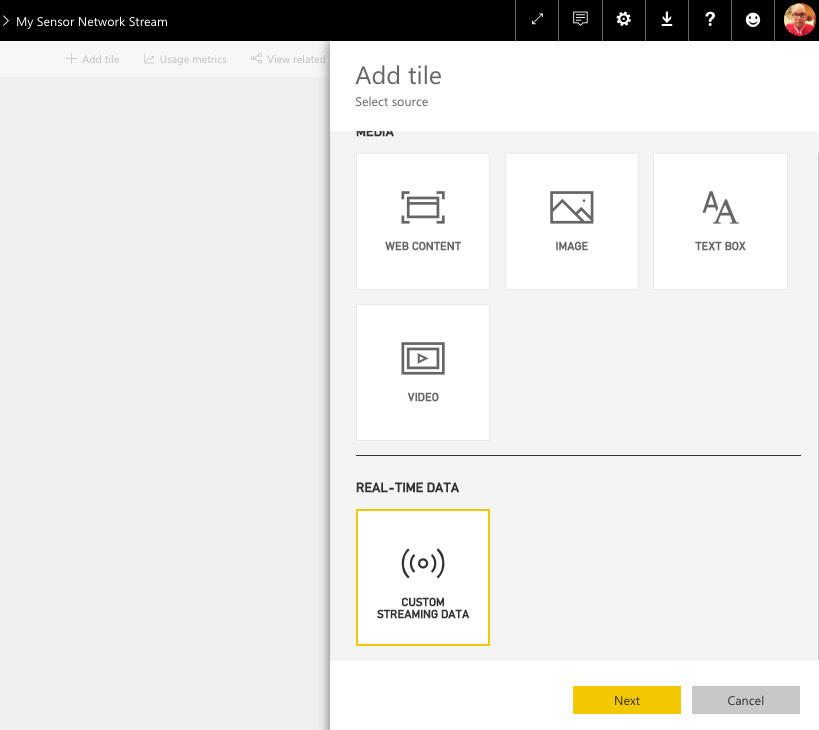
- We want to add tile(s), in the Real-Time Data section, select Custom Streaming Data, and select the Next button
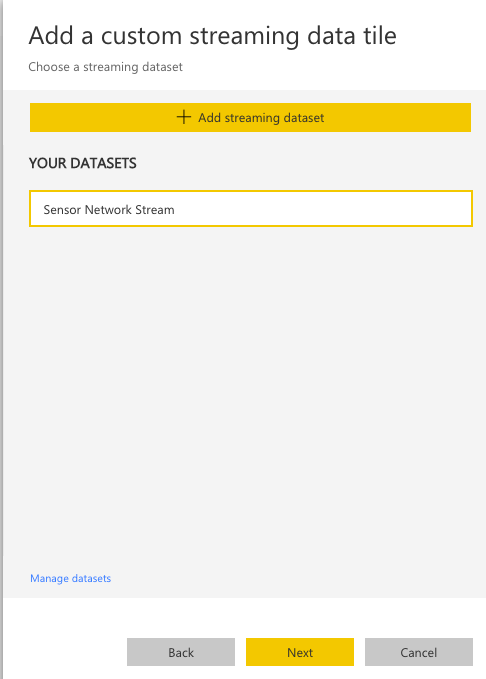
- Under Your Datasets, you should see the streaming dataset you created earlier, select it and select the Next button
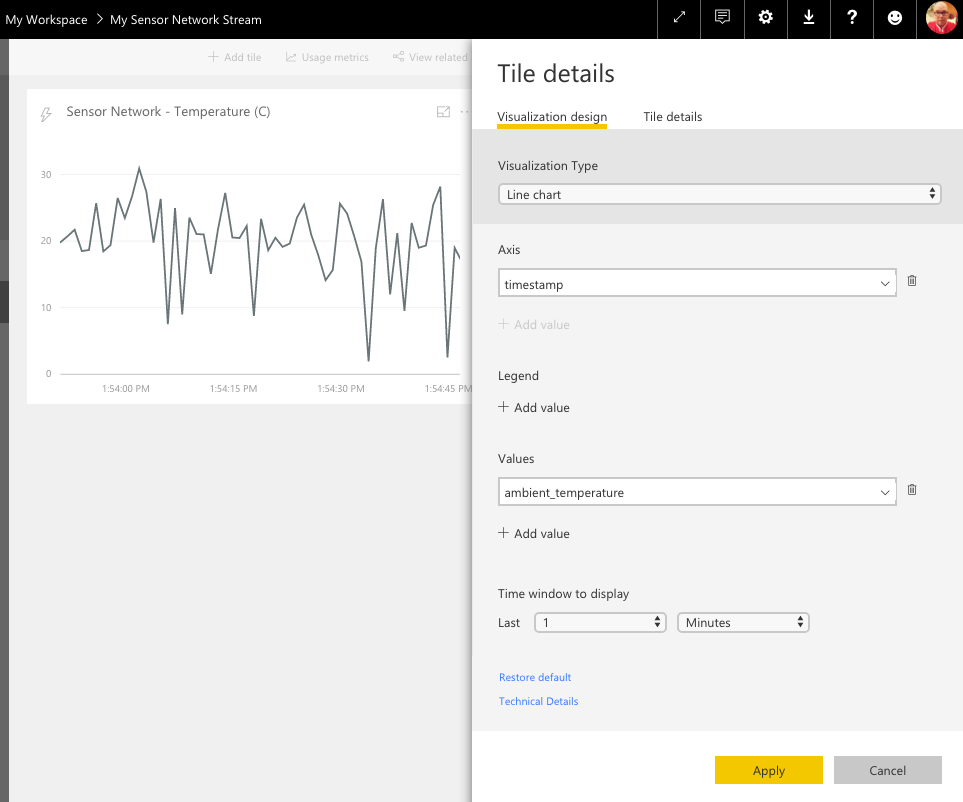
- For your Tile select Line chart from the Visualization Type, timestamp for the Axis, and ambient_temperature for Values, then select Apply
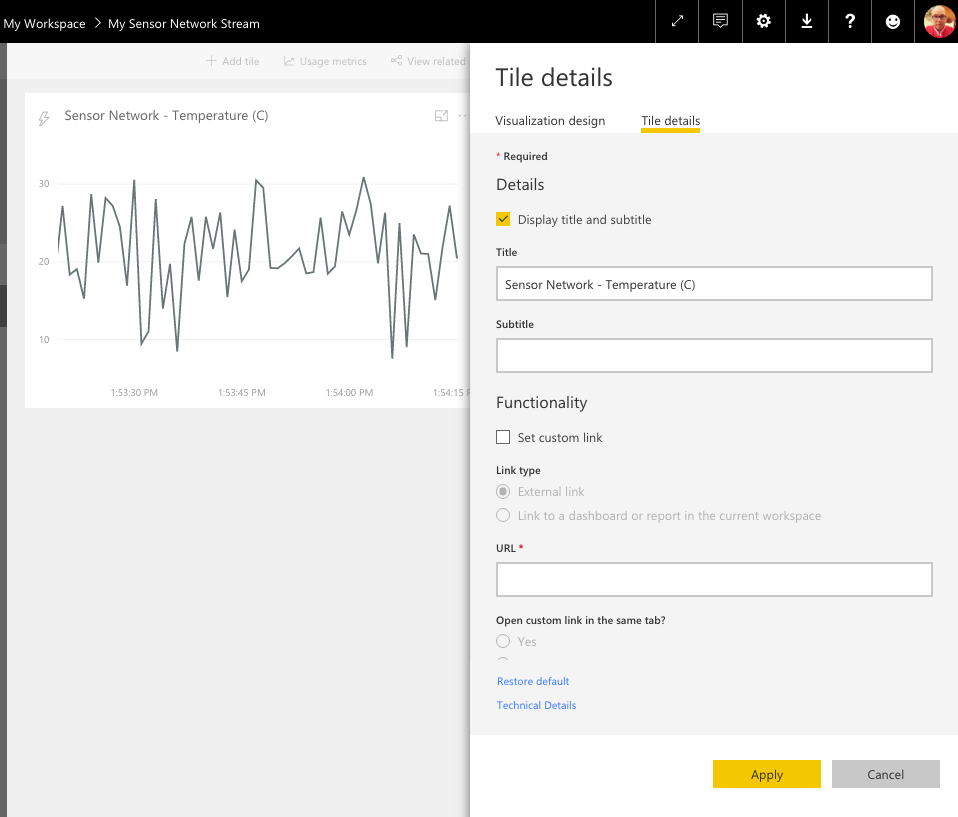
- You can provide further Tile details, like Tile, Subtitle and link functionality…
- You can add more tiles with different visualization types to your dashboard like Cards, Clustered bar charts, Clustered column charts and Gauges. I added four Cards to display the current value of each measure provided by the dataset… My final live streaming dashboard looks like this 😉
That’s a pretty simple way to demonstrate how to quickly build a Real-time streaming dashboard with Power BI
Enjoy!