
What is a graph database? Link to heading
In context, a graph database is a database that uses graph structures for semantic queries with nodes, edges and properties to represent and store data. A key concept of the system is the graph (or edge or relationship), which directly relates data items in the store. The relationships allow data in the store to be linked together directly…
Whats is a SQL Graph in SQL Server 2017? Link to heading
A collection of node and edge tables. Node or edge tables can be created under any schema in the database, but they all belong to one logical graph. Only one graph can be created per database.
Key concepts:
- A node table represents an entity in a graph schema.
- An edge table represents a relationship in a graph. Edges are always directed and connect two nodes. An edge table enables users to model many-to-many relationships in the graph. An edge table may or may not have any user defined attributes in it.
I strongly recommend you read the following -> SQL Graph Architecture to learn how SQL Graph is architected.
You can also refer to previous blog posts I did about Neo4j (which I am big fan) to understand other key concepts about Graph databases.
Let’s demo this Link to heading
We will use a dataset inspired from CraftCans.com was a site dedicated to news and reviews for the “Canned Beer Revolution”. It also contains a database of all canned craft beers available in the US which I scraped and slightly modified for our needs. I love beer, but for those who don’t know me well I prefer wine 😉
First assumption is that you have already downloaded and installed SQL Server 2017 CTP 2.0.
Then you will need to execute the following SQL script CraftCans.sql that will create the CraftCans relational database with all the required objects and load data into tables.
The CraftCans Relational Model:
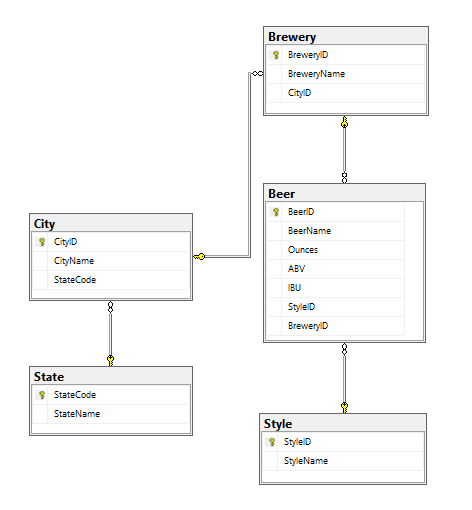
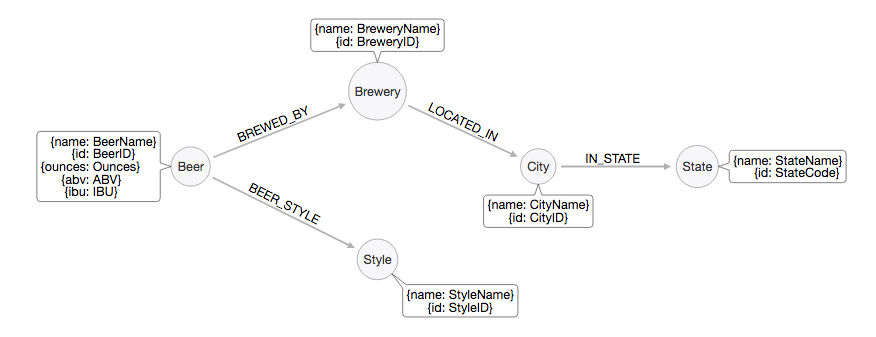
Now on to modeling our graph… I created the following property graph model to represent information about our CraftCans Graph. The property graph model is an extension of the graphs from mathematics. Property graphs provide finer-granularity on the meaning of nodes and edges (it’s the equivalent of an ERD – Entity Relationship Diagram but for Graphs)
CraftCans Property Graph Model:
First we need to create the nodes and appropriate indexes
use CraftCans;
go

create schema graph;
go

/*----------------------------------------------------
Create NODE tables
----------------------------------------------------*/

--Beer
create table graph.Beer
(
	id			int primary key,
	[name]		nvarchar(75),
	ounces		nvarchar(5),
	abv			nvarchar(5),
	ibu			nvarchar(5)
) as node;

create nonclustered index idx_Beer_name on graph.Beer ([name]);
create nonclustered index idx_Beer_ounces on graph.Beer (ounces);
create nonclustered index idx_Beer_abv on graph.Beer (abv);
create nonclustered index idx_Beer_ibu on graph.Beer (ibu);

--Brewery
create table graph.Brewery
(
	id			int primary key,
	[name]		nvarchar(50)
) as node;

create nonclustered index idx_Brewery_name on graph.Brewery([name]);

--City
create table graph.City
(
	id			int primary key,
	[name]		nvarchar(40)
) as node;

create nonclustered index idx_City_name on graph.City([name]);

--State
create table graph.[State]
(
	id			nchar(2) primary key,
	[name]		nvarchar(20)
) as node;

create nonclustered index idx_State_name on graph.[State]([name]);

--Style
create table graph.Style
(
	id			int primary key,
	[name]		nvarchar(40)
) as node;

create nonclustered index idx_Style_name on graph.Style([name]);
Then we create the edges with appropriate indexes
/*----------------------------------------------------
Create EDGE tables
----------------------------------------------------*/

--BREWED_BY
create table graph.BREWED_BY as edge;
create unique nonclustered index idx_BREWED_BY_from_id_to_id on graph.BREWED_BY ($from_id, $to_id);

--BEER_STYLE
create table graph.BEER_STYLE as edge;
create unique nonclustered index idx_BEER_STYLE_from_id_to_id on graph.BEER_STYLE ($from_id, $to_id);

--LOCATED_IN
create table graph.LOCATED_IN as edge;
create unique nonclustered index idx_LOCATED_IN_from_id_to_id on graph.LOCATED_IN ($from_id, $to_id);

--IN_STATE
create table graph.IN_STATE as edge;
create unique nonclustered index idx_IN_STATE_from_id_to_id on graph.IN_STATE ($from_id, $to_id);
We then load data into the nodes and edges tables from the relational CraftCans database model
/*----------------------------------------------------
Insert data into NODE tables
----------------------------------------------------*/

--Beer
insert into graph.Beer
	select	BeerID,
			BeerName,
			Ounces,
			ABV,
			IBU
	from	dbo.Beer;

--Brewery
insert into graph.Brewery
	select	BreweryID,
			BreweryName
	from	dbo.Brewery;

--City
insert into graph.City
	select	CityID,
			CityName
	from	dbo.City;

--State
insert into graph.[State]
	select	StateCode,
			StateName
	from	dbo.[State];

--Style
insert into graph.Style
	select	StyleID,
			StyleName
	from	dbo.Style;

/*----------------------------------------------------
Insert data into EDGE tables
----------------------------------------------------*/

--BEER_STYLE
insert into graph.BEER_STYLE
	select	g_b.$node_id as 'from_id',
			g_s.$node_id as 'to_id'
	from	dbo.Beer b join
			dbo.Style s on b.StyleID = s.StyleID join
			graph.Beer g_b on b.BeerID = g_b.id join
			graph.Style g_s on s.StyleID = g_s.id;

--BREWED_BY
insert into graph.BREWED_BY
	select	g_b.$node_id as 'from_id',
			g_br.$node_id as 'to_id'
	from	dbo.Beer b join
			dbo.Brewery br on b.BreweryID = br.BreweryID join
			graph.Beer g_b on b.BeerID = g_b.id join
			graph.Brewery g_br on br.BreweryID = g_br.id;

--LOCATED_IN
insert into graph.LOCATED_IN
	select	g_br.$node_id as 'from_id',
			g_c.$node_id as 'to_id'
	from	dbo.City c join
			dbo.Brewery br on c.CityID = br.CityID join
			graph.Brewery g_br on br.BreweryID = g_br.id join
			graph.City g_c on c.CityID = g_c.id;

--IN_STATE
insert into graph.IN_STATE
	select	g_c.$node_id as 'from_id',
			g_s.$node_id as 'to_id'
	from	dbo.[State] s join
			dbo.City c on s.StateCode = c.StateCode join
			graph.[State] g_s on s.StateCode = g_s.id join
			graph.City g_c on c.CityID = g_c.id;
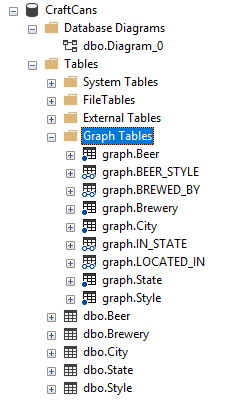
Here is a screenshot of the CraftCans database once we have created our graph model:
That’s it! We are now ready to query our graph model. The following are sample queries to explore our model, I also recommend you read the following page Create a graph database and run some pattern matching queries using T-SQL to further understand the MATCH command that enables to match a pattern or traverse through the graph.
/*----------------------------------------------------
Queries
----------------------------------------------------*/

--Return beers brewed by 'Petoskey Brewing' brewing company
select	Beer.[name] as 'Beer'
from	graph.Beer, graph.BREWED_BY, graph.Brewery
where	match (Beer-(BREWED_BY)->Brewery) and
		Brewery.[name] = 'Petoskey Brewing'

--Return beers and breweries located in Seattle
select	Beer.[name] as 'Beer',
		Brewery.[name] as 'Brewery'
from	graph.Beer, graph.BREWED_BY, graph.Brewery, graph.LOCATED_IN, graph.City
where	match (Beer-(BREWED_BY)->Brewery-(LOCATED_IN)->City) and
		City.[name] = 'Seattle'

--Return style of beers and breweries located in Anchorage
select	Beer.[name] as 'Beer',
		Style.[name] as 'Style',
		Brewery.[name] as 'Brewery'
from	graph.Style, graph.BEER_STYLE, graph.Beer, graph.BREWED_BY, graph.Brewery, graph.LOCATED_IN, graph.City
where	match (Style< -(BEER_STYLE)-Beer-(BREWED_BY)->Brewery-(LOCATED_IN)->City) and
		City.[name] = 'Anchorage'

--Return all beer properties where style of beer is 'Irish Dry Stout'
select	Beer.[name] as 'Beer',
		Beer.ounces as 'Ounces',
		Beer.abv as 'Alcohol By Volume',
		Beer.ibu as 'International Bitter Units'
from	graph.Style, graph.BEER_STYLE, graph.Beer
where	match (Style< -(BEER_STYLE)-Beer) and
		Style.[name] = 'Irish Dry Stout'

--Returns the count of beers by style
select	Style.[name] as 'Style',
		count(Beer.id) as 'Number of Beers'
from	graph.Beer, graph.BEER_STYLE, graph.Style
where	match (Beer-(BEER_STYLE)->Style)
group by
		Style.[name]
order by
		[Number of Beers] desc

--Returns the count of breweries by state
select	[State].[name] as 'State',
		count(Brewery.id) as 'Number of Breweries'
from	graph.Brewery, graph.LOCATED_IN, graph.City, graph.IN_STATE, graph.[State]
where	match (Brewery-(LOCATED_IN)->City-(IN_STATE)->[State])
group by
		[State].[name]
order by
		[Number of Breweries] desc

--Returns the count of breweries by city, state
select	[State].[name] as 'State',
		City.[name] as 'City',
		count(Brewery.id) as 'Number of Breweries'
from	graph.Brewery, graph.LOCATED_IN, graph.City, graph.IN_STATE, graph.[State]
where	match (Brewery-(LOCATED_IN)->City-(IN_STATE)->[State])
group by
		[State].[name],
		City.[name]
order by
		[Number of Breweries] desc
It’s important to note that Microsoft is starting to add graph extension to SQL Server, to make storing and querying graph data easier. These are the features that were introduced in this first release. Looking forward to the upcoming releases and explore what’s new in SQL Graph in SQL Server 2017.
Keep you posted
Enjoy!